
Trillion Peso March ($TPM)
7kPTYhH5TwPQhTvMNdLHWUxE59ffW9dxTWXR3Qkk2che
$0.000033
0.0000001364 SOL
+383.00% (24h)
Market Cap
$326,020
Liquidity
$294,485
Holders
0(Top 10: 0.00%)
Blockchain
Solana
Contract Address
7kPTYhH5TwPQhTvMNdLHWUxE59ffW9dxTWXR3Qkk2che
AGE
2 hours (Sep 21, 2025)
DEXes
Raydium
About Trillion Peso March
Trillion Peso March (TPM) is a meme token inspired by Philippine currency culture. It thrives through social media activities and community engagement, aiming to celebrate Philippine culture and digital innovation.
Trillion Peso March (TPM) 7kPTYhH5TwPQhTvMNdLHWUxE59ffW9dxTWXR3Qkk2che is a 2 hours old token on the Solana blockchain. Current price: $0.000033 (+383.00% 24h). Market cap: $326,020. Liquidity: $294,485. Contract: 7kPTYhH5TwPQhTvMNdLHWUxE59ffW9dxTWXR3Qkk2che. Tracked on Dexscreener. Traded on Raydium.
Key Factors & Recent Activity 2025-09-21T09:19:00
- Hey, here’s a quick take on TPM:
- Price jumped over 50% in one hour – quite a sudden spur.
- Trading activity is high, with lots of buys and sells happening.
- Liquidity sits around 164K USD, making trading a bit smoother.
- Market cap is low (~102K USD), so the token can be very volatile.
- The creator risk flag is addressed, but risk score is about 55.
- No big news announcement here, just a rapid price movement. My gut feeling? This token shows a big, fast swing that might be a chance if you can handle bumps. However, caution is key with these low market cap tokens—keep a close eye if you decide to watch further.
Disclaimer: Information provided is for general purposes only and not financial advice. Meme tokens can be highly volatile. Always do your own research (DYOR).
TPM/SOL Price Chart
| Timeframe | Price Change | Volume (USD) |
|---|---|---|
| 5 Min | +0.17% | $84,828.15 |
| 1 Hour | +123.00% | $1,982,066.81 |
| 6 Hours | +383.00% | $4,024,731.53 |
| 24 Hours | +383.00% | $4,024,731.53 |
Statistics
Market Cap
$326,020
Volume (24h)
$4,024,731.53
Fully Diluted Valuation (FDV)
$326,020
Circulating Supply
0
Total Supply
0
Max Supply
0
Holders
0+
All Time High (ATH)
N/A
All Time Low (ATL)
N/A
Buyers & Sellers Overview
| Timeframe | Net Buyers | Total Traders | Buyers | Sellers |
|---|---|---|---|---|
| 5 Min | +17 | 641 | 329 | 312 |
| 1 Hour | +426 | 15,422 | 7,924 | 7,498 |
| 6 Hours | +1,613 | 33,149 | 17,381 | 15,768 |
| 24 Hours | +1,613 | 33,149 | 17,381 | 15,768 |
Net Buyers = Number of buyers minus sellers. Data summed across all available pairs for this token.
Listed On
Trackers:
DEX Markets:
Trading Pairs for
7kPTYhH5TwPQhTvMNdLHWUxE59ffW9dxTWXR3Qkk2che
DEX: Raydium
Pair With: TPM/SOL
Liquidity: $294,485
Community Mentions For #TPM

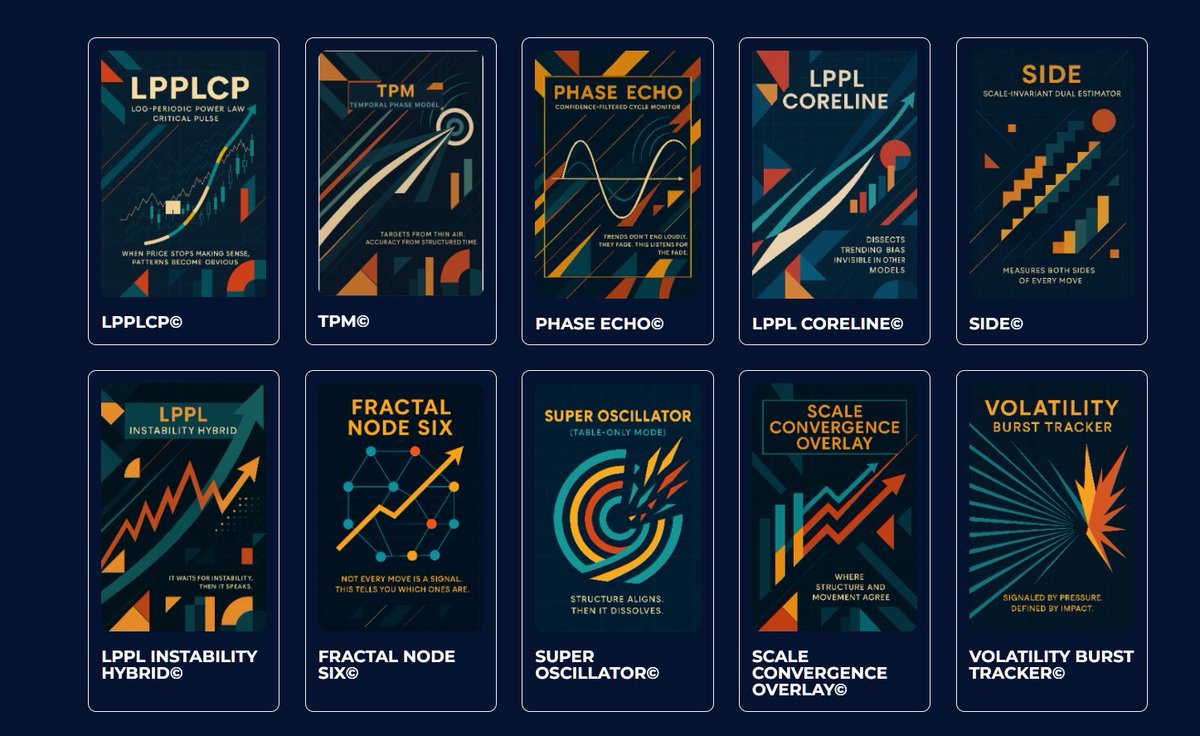
Amazing indicators built on science.
Link in the comments.

We are going to look at the Bitcoin price action using principles from Complexity Theory and science of criticality.
Building on physics, self-organized criticality (SOC) is a theory for how complex systems naturally evolve to a critical state without external fine-tuning. Introduced by Per Bak in the 1980s, it explains phenomena like earthquakes, avalanches, or forest fires, where energy builds up slowly and releases in bursts following power-law statistics (e.g., the Gutenberg-Richter law for earthquake magnitudes).In SOC models, like the sandpile model, adding "grains" (inputs) leads to avalanches of varying sizes when the pile reaches a critical slope.
This criticality emerges from local interactions, promoting adaptability and efficiency in systems ranging from biological evolution to stock markets.
Bitcoin is an ideal system to be studied using these tools.
Join us here on X, Twitch and YouTube. Links in the comment.
TROLL
0.09856080
1.1 yr
XNY
0.00934619
2 MOn
XRP
2.98201092
2.5 yr
RICE
0.09138640
1 MOn
neet
0.01659240
5 MOn