
sell dollar and buy gold ($GOLD)
7s8s44RsbK2fWs56KPgc49Ku2r9nVKCFiiRHNZZt6KYV
$0.000308
0.000001526 SOL
+427.00% (24h)
Market Cap
$308,387
Liquidity
$137
Holders
0(Top 10: 0.00%)
Blockchain
Solana
Contract Address
7s8s44RsbK2fWs56KPgc49Ku2r9nVKCFiiRHNZZt6KYV
AGE
4 hours (Oct 14, 2025)
DEXes
Raydium, Meteora
About sell dollar and buy gold
The GOLD token is inspired by a tweet from the Business X account that says 'sell dollar and buy gold', representing the strategy of 'sell dollar and buy gold'. This token reflects a questioning attitude towards traditional finance and represents an alternative to traditional assets in the cryptocurrency space.
sell dollar and buy gold (GOLD) 7s8s44RsbK2fWs56KPgc49Ku2r9nVKCFiiRHNZZt6KYV is a 4 hours old token on the Solana blockchain. Current price: $0.000308 (+427.00% 24h). Market cap: $308,387. Liquidity: $137. Contract: 7s8s44RsbK2fWs56KPgc49Ku2r9nVKCFiiRHNZZt6KYV. Tracked on Dexscreener. Traded on Raydium, Meteora.
Key Factors & Recent Activity 2025-10-14T18:52:53
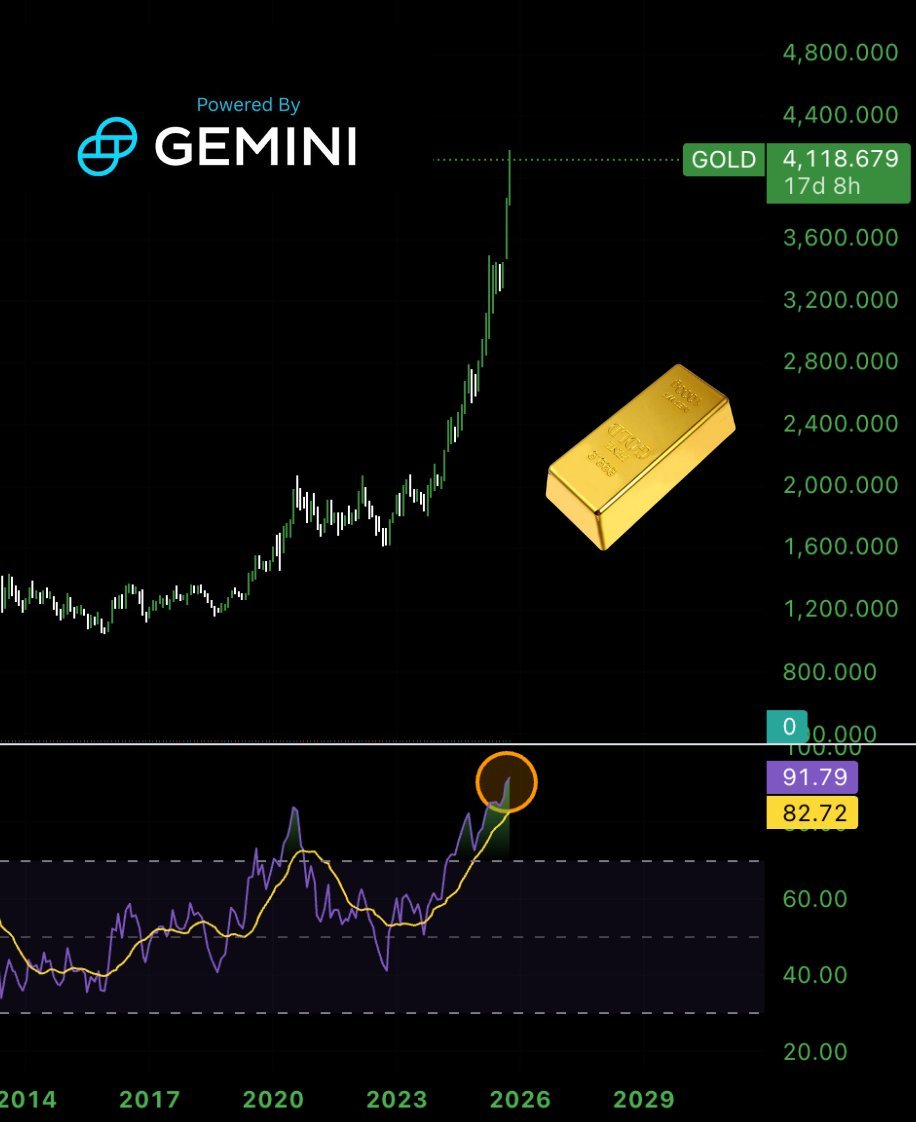
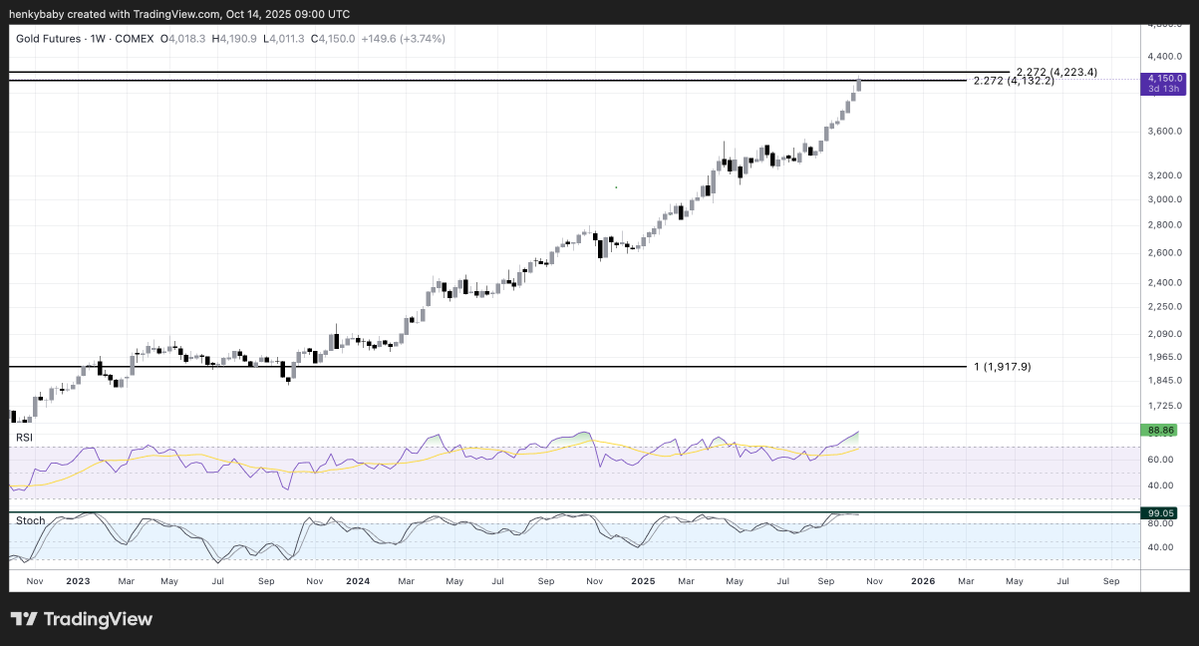
- Gold news is making waves—“Gold Skyrockets Past $4K” headlines stir market chatter.
- Central banks hint at holding gold along with Bitcoin by 2030.
- This token’s price jumped over 300% in a short time; super exciting but very volatile.
- It’s traded against SOL on a popular decentralized exchange with modest liquidity.
- The token’s risk score is 55, which shows some caution but isn’t a glaring red flag yet.
- Big gold rally news might push interest, yet extreme price swings can trick you.
- If you’re watching closely and willing to ride volatility, it could have promise—but be careful!
Disclaimer: Information provided is for general purposes only and not financial advice. Meme tokens can be highly volatile. Always do your own research (DYOR).
GOLD/SOL Price Chart
| Timeframe | Price Change | Volume (USD) |
|---|---|---|
| 5 Min | +0.00% | $0.00 |
| 1 Hour | +0.00% | $0.00 |
| 6 Hours | +427.00% | $5,098,431.84 |
| 24 Hours | +427.00% | $5,098,431.84 |
Statistics
Market Cap
$308,387
Volume (24h)
$5,098,441.57
Fully Diluted Valuation (FDV)
$308,387
Circulating Supply
0
Total Supply
0
Max Supply
0
Holders
0+
All Time High (ATH)
N/A
All Time Low (ATL)
N/A
Buyers & Sellers Overview
| Timeframe | Net Buyers | Total Traders | Buyers | Sellers |
|---|---|---|---|---|
| 5 Min | +0 | 0 | 0 | 0 |
| 1 Hour | -1 | 1 | 0 | 1 |
| 6 Hours | +12,505 | 31,733 | 22,119 | 9,614 |
| 24 Hours | +12,505 | 31,733 | 22,119 | 9,614 |
Net Buyers = Number of buyers minus sellers. Data summed across all available pairs for this token.
Listed On
Trackers:
DEX Markets:
Trading Pairs for
7s8s44RsbK2fWs56KPgc49Ku2r9nVKCFiiRHNZZt6KYV
DEX: Raydium
Pair With: GOLD/SOL
Liquidity: $137
DEX: Meteora
Pair With: GOLD/SOL
Liquidity: $11
Community Mentions For #GOLD

Rotation into Bitcoin next?


What if... just use your imagination and alternative mindset here..
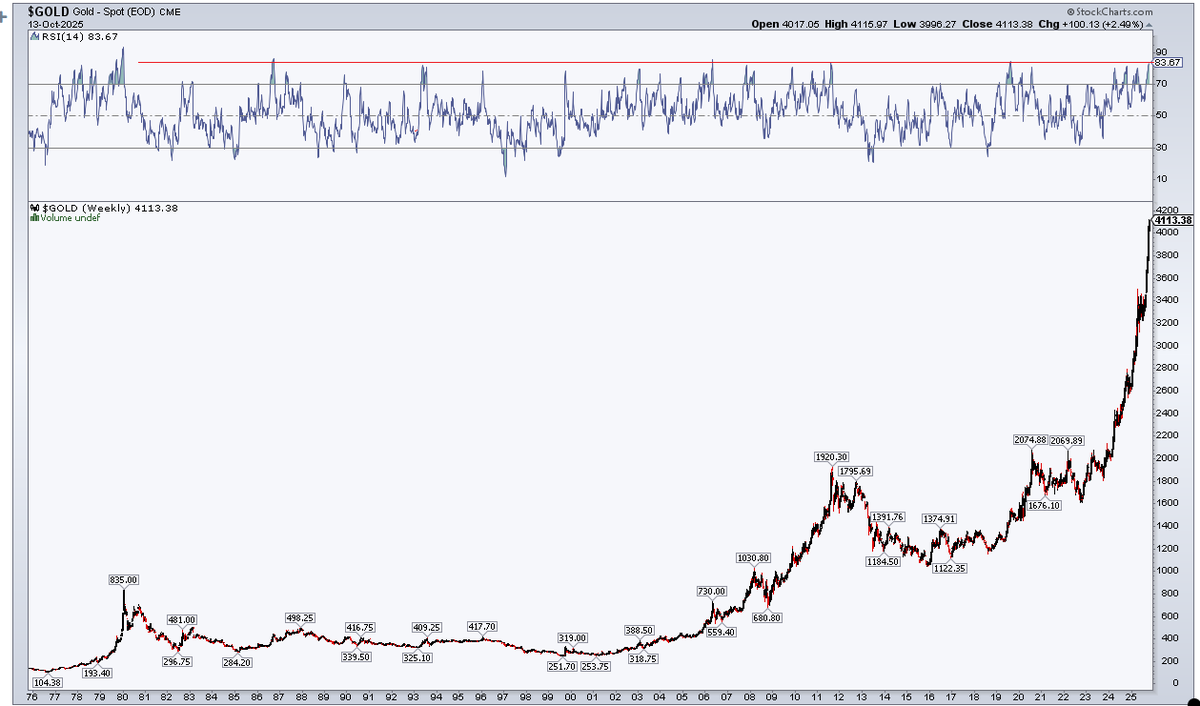
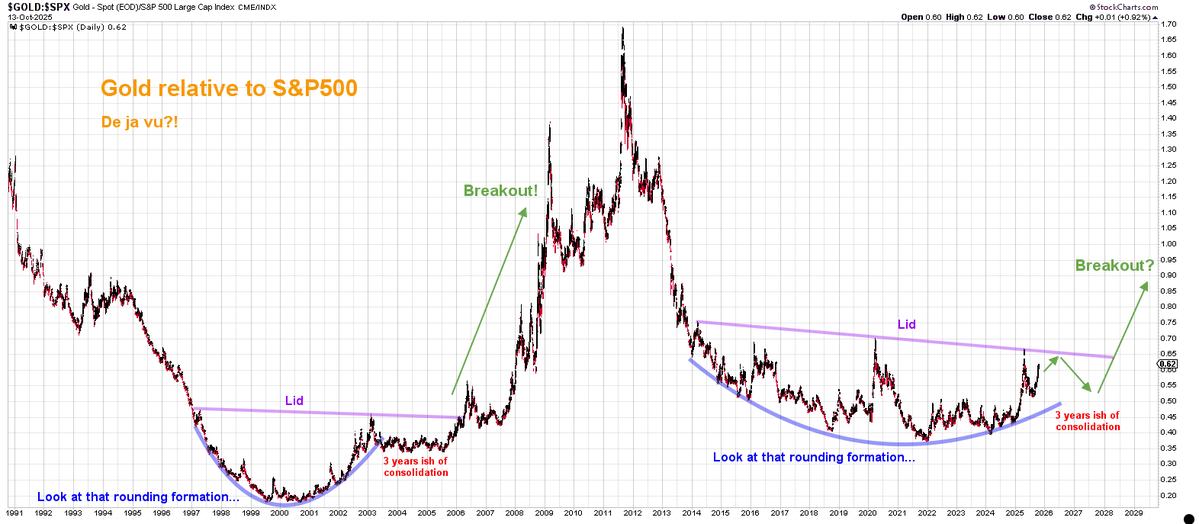
What if we today are following in the same footsteps as the end of the dotcom bubble leading into the GFC of Gold?
Keep in mind, this chart is Gold relative to $SPX.
Notice at the end of the 2000's bubble burst, gold's outperformance of equities started rising up kind of foreshadowing the next crisis in the GFC. It sniffed it out years in advance actually. And once chaos occurred, gold really shined whereas equities did not.
Are we doing something similar here where at the end of the 2022 inflation fears bear market gold bottomed and is now starting to create this rounding curl formation just like the prior rounding formation before the massive breakout?
Certainly seems like it.
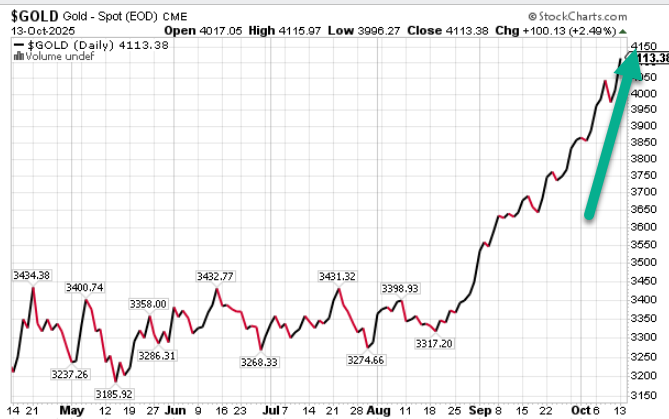
This can play out for the next few years up to the end of this decade perhaps so there's still ample time where we can see gold oscillate and create a base here and then breakout towards $10,000+. Yes you read that right. The first breakout into the GFC was a 300% gain from the breakout point.
Today we are only at 100% or so. We could easily double and then some again.
The chart looks eerily similar.
-Heis

🟩 $SHIB 🟩 $MASK 🟥 $GOLD
Top 3 Buzzing Cryptos: MP | #SmartMoney
🟩 $SHIB
Check out sentiment and other crypto stats at

PUMP
0.00407626
3 MOn
LION
0.00693780
19.9 Days
喵星人
0.00180994
24 H
nussy
0.00017338
36 Min
唢呐
0.00007994
6 Min