

User Cult ($USER)
GbrFUfAKSksRGJxqyy76ppcvNGPMh633nDA7ufxebonk
$0.000021
0.0000001126 SOL
-73.52% (24h)
Market Cap
$21,029
Liquidity
$16,998
Holders
0(Top 10: 0.00%)
Blockchain
Solana
Contract Address
GbrFUfAKSksRGJxqyy76ppcvNGPMh633nDA7ufxebonk
AGE
8 hours (Jul 28, 2025)
DEXes
Raydium, Meteora, Launchlab
About User Cult
The token name 'User Cult' stems from its official positioning as 'cult leader', with the background event being that the official account attracted 24,000 users in a short period and announced 'user cult is assembling' and 'that’s when this cult starts' via tweets. The narrative logic of this token centers around 'user assembly', emphasizing the gathering action of the user group through expressions like 'We must all assemble' and 'this cult starts'.
User Cult (USER) GbrFUfAKSksRGJxqyy76ppcvNGPMh633nDA7ufxebonk is a 8 hours old token on the Solana blockchain. Current price: $0.000021 (-73.52% 24h). Market cap: $21,029. Liquidity: $16,998. Contract: GbrFUfAKSksRGJxqyy76ppcvNGPMh633nDA7ufxebonk. Tracked on Dexscreener. Traded on Raydium, Meteora, Launchlab.
Key Factors & Recent Activity 2025-07-28T13:40:10
- Recently, the trading numbers spiked—lots of buying and selling in a short time.
- Price jumped by almost 15% over several hours but fell nearly 30% in one hour.
- The liquidity pool holds around $35K, which isn’t huge but seems stable for now.
- The token is on the Solana network, so it rides on that fast, busy blockchain.
- There are hints of risk with insider activity scores and a moderate risk rating of 40.
- Auditing checks show some reassuring points, like no bad wallet flags.
- With the sudden price swings and these mixed signals, it feels a bit risky.
Disclaimer: Information provided is for general purposes only and not financial advice. Meme tokens can be highly volatile. Always do your own research (DYOR).
USER/SOL Price Chart
| Timeframe | Price Change | Volume (USD) |
|---|---|---|
| 5 Min | -3.86% | $287.51 |
| 1 Hour | -10.37% | $2,378.56 |
| 6 Hours | -83.05% | $170,498.06 |
| 24 Hours | -73.52% | $579,365.86 |
Statistics
Market Cap
$21,029
Volume (24h)
$636,137.83
Fully Diluted Valuation (FDV)
$21,029
Circulating Supply
0
Total Supply
0
Max Supply
0
Holders
0+
All Time High (ATH)
N/A
All Time Low (ATL)
N/A
Buyers & Sellers Overview
| Timeframe | Net Buyers | Total Traders | Buyers | Sellers |
|---|---|---|---|---|
| 5 Min | -2 | 4 | 1 | 3 |
| 1 Hour | -8 | 52 | 22 | 30 |
| 6 Hours | -80 | 1,976 | 948 | 1,028 |
| 24 Hours | +859 | 7,069 | 3,964 | 3,105 |
Net Buyers = Number of buyers minus sellers. Data summed across all available pairs for this token.
Listed On
Trackers:
DEX Markets:
Trading Pairs for
GbrFUfAKSksRGJxqyy76ppcvNGPMh633nDA7ufxebonk
DEX: Raydium
Pair With: USER/SOL
Liquidity: $16,998
DEX: Meteora
Pair With: USER/SOL
Liquidity: $11
DEX: Meteora
Pair With: USER/SOL
Liquidity: $166
DEX: Launchlab
Pair With: USER/SOL
Liquidity: $N/A
Community Mentions For #USER

911 followers · Jul 28, 2025, 10:56 AM
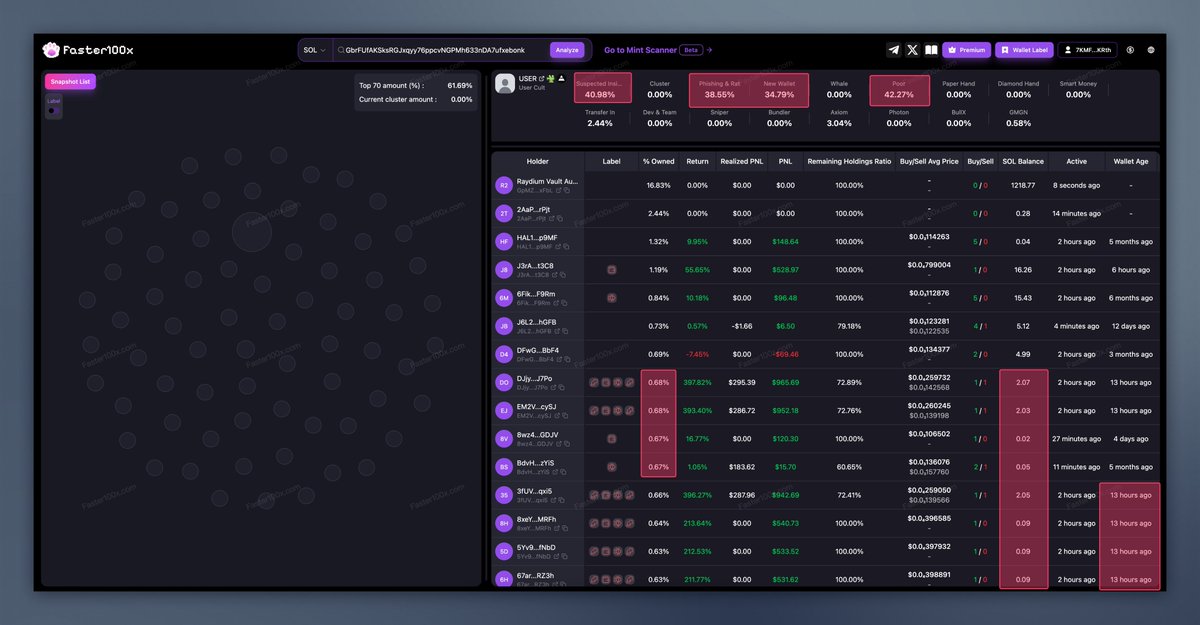
⚠️ Hold on! Bubble charts that look too clean or too messy often signal red flags.
✅ If it’s too clean, it might mean the team (DEV) is deliberately hiding wallet connections, and very few real retail users are involved — which results in a chart with almost no visible links.
💡 A healthy token usually has moderate and natural wallet connections on the bubble chart.
Example Wallet
GbrFUfAKSksRGJxqyy76ppcvNGPMh633nDA7ufxebonk
($USER)
Even if the bubble chart itself seems normal, behavioral patterns can still reveal the DEV’s tricks:
🔸 Front-ranked wallets are all low-balance “empty” wallets
🔸 Identical holding ratios across wallets
🔸 Nearly the same purchase amounts
🔸 Wallets created around the same time
Don’t trust appearances — trust the patterns.

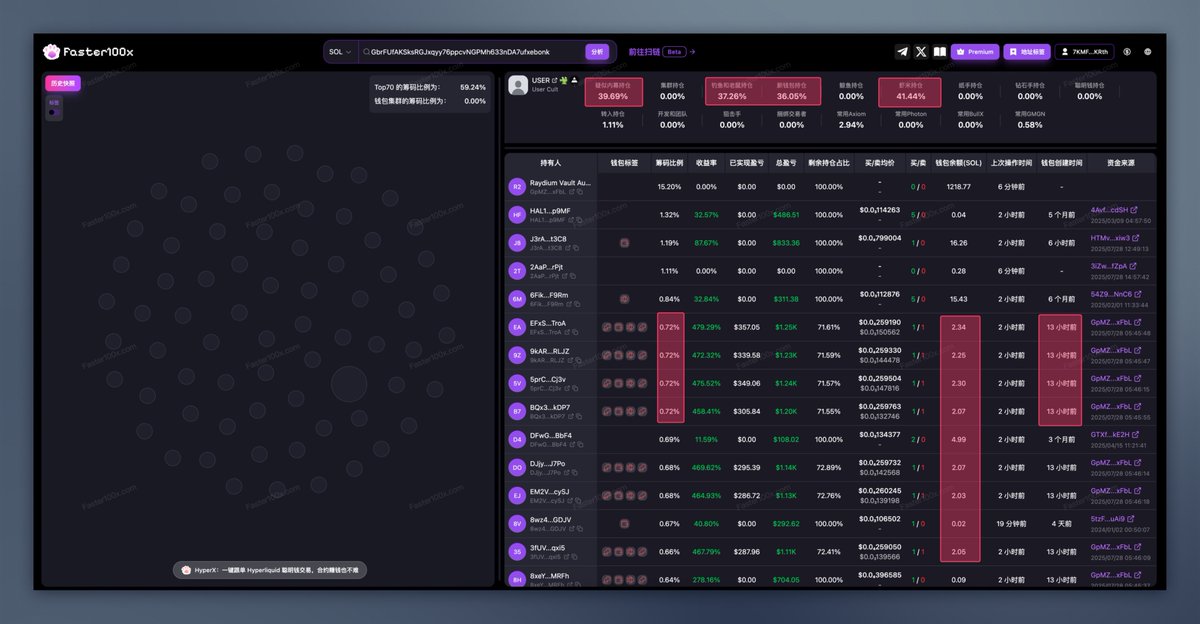
5,675 followers · Jul 28, 2025, 10:51 AM
⚠️ 别急!太清白 or 太复杂 的气泡图,往往都不太正常
✅ 太清白,可能是团队(DEV)有意隐藏资金链,且散户很少入场,才导致图上毫无关联
💡 一个健康的项目,气泡图应有适度关联,才是正常的情况
$USER
GbrFUfAKSksRGJxqyy76ppcvNGPMh633nDA7ufxebonk
光看气泡图可能看不出异常,但通过行为特征分析,DEV 的破绽还是一目了然:
🔸 前排都是资产很低的“穷鬼”钱包
🔸 持仓比例高度一致
🔸 买入金额几乎一样
🔸 钱包创建时间集中
欢迎来一起筹码分析:
DREAM
0.00141597
3 H
DETECTIVE
0.00405577
13.4 Days
UPTOP
0.02010889
1 MOn
MILK
0.04926029
3 MOn
KOGE
47.99632856
2.3 yr